Introducing ChartGPT: The AI Tool for Customizable and Interactive Data Visualization
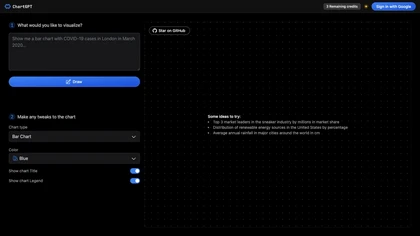
ChartGPT is an innovative AI-powered platform that enables users to generate, modify, and present various types of charts with ease. With its user-friendly interface, ChartGPT offers a range of chart options, including bar charts, area charts, line charts, pie charts, scatter charts, radar charts, radial bar charts, treemaps, and funnel charts.
Users can customize their charts to suit their preferences by adjusting colors, titles, and legends. ChartGPT empowers users to create stunning and interactive visuals that effectively convey complex data sets in a clear and engaging manner. It is an invaluable tool for professionals in different fields, including marketing, finance, and research, among others.
ChartGPT is ideal for a wide range of data visualization projects, from illustrating market share distribution to showing renewable energy sources percentages or average annual rainfall in major cities worldwide. With its flexibility and functionality, ChartGPT makes data visualization more accessible and efficient, allowing users to create high-quality charts in a matter of minutes.
Experience the power of ChartGPT today and take your data visualization projects to the next level!

