Introducing Diagram.chat: The AI-Powered Tool for Data Analysis and Visualization
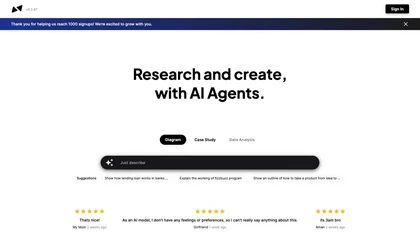
Diagram.chat is an innovative tool that harnesses the power of artificial intelligence to help users gain insights from complex data sets. Its latest version, 0.2.97, boasts a range of features that make it an invaluable asset for anyone looking to visualize data or analyze case studies.
Understanding Complex Information through Diagrams and Charts
Diagram.chat’s AI capabilities enable it to create diagrams and charts that effectively communicate complex information. With this tool, users can easily visualize relationships between data points, identify patterns, and uncover insights that might otherwise be missed.
Seamless Navigation and AI-Generated Insights
Diagram.chat’s user-friendly dashboard allows for seamless navigation and easy access to AI-generated insights. Users can quickly analyze data and gain a deeper understanding of trends and patterns without the need for extensive technical knowledge.
A Real-World Use Case
Diagram.chat can be used in a variety of real-world scenarios, from business analytics to scientific research. For example, a marketing team could use the tool to analyze consumer behavior and identify opportunities for growth. A research team could use Diagram.chat to visualize complex data sets and gain insights into scientific phenomena.
Overall, Diagram.chat is a powerful tool that offers a range of benefits for anyone looking to analyze data or visualize complex information. With its AI-powered capabilities and user-friendly interface, it’s a must-have for anyone looking to gain insights from data.

